Editing The Grid
Edit The Grid
Use this feature to help Markup R-XP detect your chart and create a matching grid overlay.
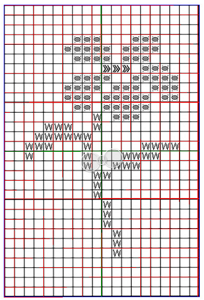
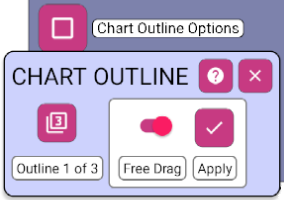
Chart Outline Options
Use this option to allow free dragging of the outline or, if multiple outlines exist, select between them.
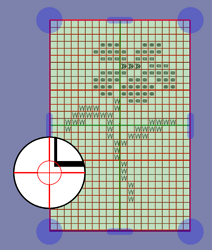
The Magnifier
As you drag the grid handles, a magnifier will appear to help you align the edges of the grid and the chart precisely.
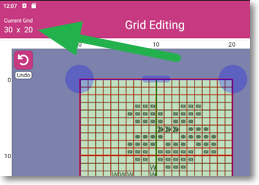
Checking The Grid Size
As you move the grid outline, the number of grid rows and columns detected will be automatically displayed at the top of the screen.
Alignment Check
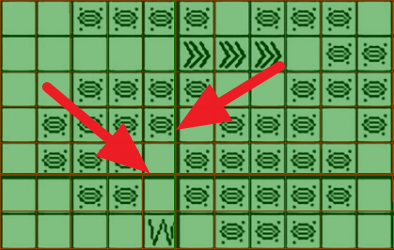
When you have lined up the chart and grid outlines, zoom in and check whether the grid lines exactly line up with the grid on the chart.
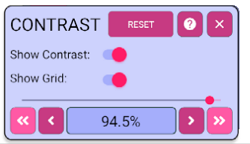
Change Contrast
Sometimes the chart can be too light or dark to successfully detect the grid. Click 'Adjust Chart Contrast' to adjust the brightness level and help grid detection.
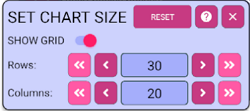
Set Chart Size
If the grid still hasn't been correctly detected, use the 'Set Chart Size' button to set the size manually.
Done & Quit
When the grid is correctly aligned and has the right number of rows and columns, click the 'Done' button to Save. Click the 'Quit' button to discard any changes.