Information & Statistics
The Infomation Icons
These 4 buttons allow you to access your markup stats. They are DASHBOARD, HISTORY, WIP (Work in progress) and NOTES. Click the relevant button to see the stats.
![]()
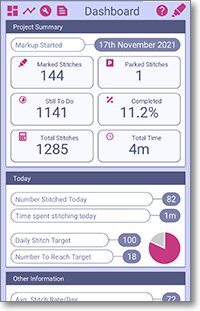
The Dashboard
The dashboard displays project level stats as well as daily target progress (if set)
History
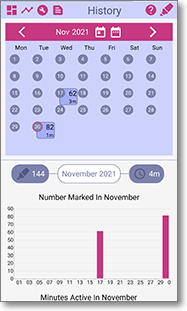
See your markup progress by day, month or year. Includes graphs and tabular data.
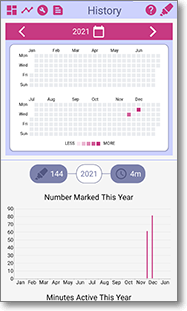
You can see an overview of a whole year of your marking up.
WIP (Work in progress)
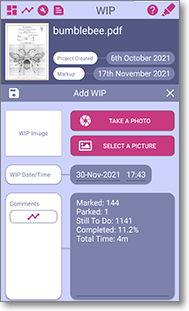
Log your progress as you markup and view in a handy date ordered list.
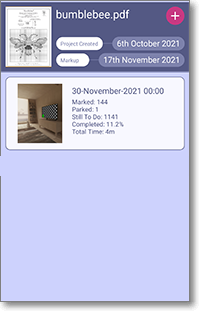
Add photos or stored pictures, enter the date and time and add your notes. A snapshot of current stats can also be automatically added.
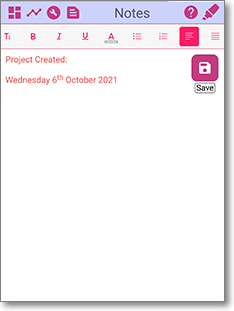
Notes
Use the notes tab to store project notes, comments and other information.
